Frequently asked questions and terms: draught, low water, high water and inland shipping
This page covers the most important terms and frequently asked questions about the draught of inland vessels during low water on the Rhine, Waal, IJssel, Nederrijn, Lek and Danube. From reference water levels such as GlW, OLR, RNW and the Least Sounded Depth (MGD) to payload during low water, the low-water surcharge, but also topics that matter more during high water, such as calculating bridge clearances. Click a question to expand the answer.
Rules of thumb/Marke I/Marke II for all gauges and ports
Set corrections:
Rijn
| Name | KM | Section | GlW/OLR (cm) | TuGlW (cm) | Official Safety Margin (cm) | Official Rule (cm) | Correction (cm) | Adj. Rule (cm) | ||
|---|---|---|---|---|---|---|---|---|---|---|
| Up | Down | Up | Down | |||||||
| Basel-Rheinhalle | 166 | 163-170 | 501 | 295 | 40 | -246 | -246 | -246 | ||
| ↳ Rheinfelden | 148.08 | 148.08 | - | - | - | - | - | - | ||
| ↳ Hafenbecken I+II | 168 | - | - | - | - | - | - | - | ||
| Iffezheim | 334 | 334-384 | - | - | - | - | +80 | +80 | ||
| ↳ Beinheim | 339 | - | - | - | - | - | +100 | +100 | ||
| Maxau | 362 | 335-384 | 372 | 210 | 30 | -192 | -180 | -180 | ||
| ↳ Karlsruhe Stadthafen | 360 | - | - | - | - | - | -180 | -180 | ||
| ↳ Karlsruhe Ölhafen | 361 | - | 372 | 210 | 30 | -192 | -192 | -192 | ||
| ↳ Wörth | 366 | - | 372 | 210 | 30 | -192 | -192 | -192 | ||
| Speyer | 400 | 384-410.5 | 237 | 210 | 30 | -57 | -20 | -20 | ||
| ↳ Germersheim | 385 | - | 237 | 210 | 30 | -57 | -57 | -57 | ||
| ↳ Rheinhausen (Kiesverladestelle) | 394 | - | 237 | 210 | 30 | -57 | -57 | -57 | ||
| ↳ Ölhafen Speyer | 399 | - | - | - | - | - | -40 | -40 | ||
| Mannheim | 424 | 410.5-431.5 | 155 | 210 | 30 | +25 | +40 | +40 | ||
| ↳ Rheinau | 415 | - | 155 | 210 | 30 | +25 | +25 | +25 | ||
| ↳ Kaiserwörthhaven | 421 | - | 155 | 210 | 30 | +25 | +25 | +25 | ||
| ↳ Einfahrt Neckar | 428 | - | 155 | 210 | 30 | +25 | +60 | +60 | ||
| ↳ Ludwigshafen | 432 | - | - | - | - | - | +70 | +70 | ||
| Worms | 443 | 431.5-462 | 68 | 210 | 30 | +112 | +150 | +150 | ||
| ↳ Lampertheimer Altrhein | 437 | - | 68 | 170 | 30 | +72 | +80 | +80 | ||
| ↳ Gernsheim | 462 | - | - | - | - | - | +90 | +90 | ||
| Mainz | 498 | 462-508 | 171 | 210 | 30 | +9 | +30 | +30 | ||
| ↳ Gustavsburg | 496 | - | - | - | - | - | +9 | +9 | ||
| ↳ Einfahrt Main bis Kostheim | 497 | - | 171 | 210 | 30 | +9 | +40 | +40 | ||
| ↳ Wiesbaden | 502 | - | 171 | 210 | 30 | +9 | +30 | +30 | ||
| ↳ Mainz Mombach/Industriehafen | 504 | - | 171 | 210 | 30 | +9 | +30 | +30 | ||
| Oestrich | 518 | 508-540 | 92 | 190 | 30 | +68 | +110 | +110 | ||
| ↳ Hafen Bingen | 527 | - | 92 | 210 | 30 | +88 | +108 | +108 | ||
| Bingen | 528 | 528-540 | - | - | - | - | +100 | +100 | ||
| Kaub | 546 | 541-566 | 77 | 190 | 30 | +83 | +100 | +100 | ||
| ↳ Schutzhafen Oberwesel | 550 | - | 77 | 190 | 30 | +83 | +50 | +50 | ||
| ↳ Loreleyhafen | 555 | - | 77 | 210 | 30 | +103 | +103 | +103 | ||
| Koblenz | 591 | 566-592 | 77 | 210 | 30 | +103 | +130 | +130 | ||
| Koblenz (Mosel) | 592 | 592-601 | 77 | 250 | 30 | +143 | +130 | +130 | ||
| Andernach | 613 | 601-624 | 91 | 250 | 30 | +129 | +129 | +129 | ||
| ↳ Bendorf | 599 | - | 91 | 250 | 30 | +129 | +129 | +129 | ||
| ↳ Hafen Neuwied | 606.5 | - | 91 | 250 | 30 | +129 | +90 | +90 | ||
| ↳ Hafen Wallersheim | 612 | - | 91 | 250 | 30 | +129 | +110 | +110 | ||
| ↳ Hafen Brohl | 621 | - | 91 | 250 | 30 | +129 | +100 | +100 | ||
| Bonn | 655 | 624-660 | 142 | 250 | 30 | +78 | +78 | +78 | ||
| Köln | 688 | 660-710 | 139 | 250 | 30 | +81 | +80 | +80 | ||
| ↳ Wesseling | 668 | - | 139 | 199 | 30 | +30 | +30 | +30 | ||
| ↳ Godorf | 672 | - | 139 | 229 | 30 | +60 | +60 | +60 | ||
| ↳ Köln Niehl 1 | 696 | - | 139 | 219 | 30 | +50 | +50 | +50 | ||
| ↳ Dormagen | 712 | - | 139 | 250 | 30 | +81 | +81 | +81 | ||
| Düsseldorf | 744 | 710-763 | 91 | 250 | 30 | +129 | +130 | +130 | ||
| ↳ Stürzelberg | 725 | - | 91 | 250 | 30 | +129 | +125 | +125 | ||
| ↳ Düsseldorf Neuss | 740 | - | 91 | 250 | 30 | +129 | +125 | +125 | ||
| ↳ Hafen Düsseldorf | 743 | - | 91 | 250 | 30 | +129 | +130 | +130 | ||
| Duisburg-Ruhrort | 780 | 763-794 | 227 | 280 | 30 | +23 | +20 | +20 | ||
| ↳ Krefeld | 764 | - | 227 | 280 | 30 | +23 | -20 | -20 | ||
| ↳ Uerdingen | 765 | - | 227 | 280 | 30 | +23 | -30 | -30 | ||
| ↳ Rheinhausen (Hafen Krupp) | 773.6 | - | 227 | 280 | 30 | +23 | +0 | -30 | ||
| ↳ Ruhr, Mündung bis Ruhrschleuse | 780.1 | - | 227 | 235 | 0 | +8 | +8 | +8 | ||
| ↳ Rhein-Herne-Kanal/Hafenkanal | 780.3 | - | 227 | 265 | 0 | +38 | +38 | +38 | ||
| Wesel | 814 | 794-837 | 174 | 280 | 30 | +76 | +80 | +80 | ||
| ↳ Wesel-Datteln-Kanal, Mündung bis Schleuse | 813 | - | 174 | 235 | 0 | +61 | +61 | +61 | ||
| Emmerich | 852 | 837-857 | 74 | 280 | 30 | +176 | +206 | +206 | ||
| ↳ Emmerich Industriehafen | 851.6 | - | 74 | 280 | 30 | +176 | +150 | +150 | ||
| ↳ Spyck Rapsverladung | 857 | - | 74 | 280 | 30 | +176 | +100 | +100 | ||
| Lobith | 862.18 | 857-867.5 | 733 | 280 | 30 | -483 | -453 | -453 | ||
Waal
| Name | KM | Section | OLR/OLW (cm) | TuOLR (cm) | Official Safety Margin (cm) | Official Rule (cm) | Correction (cm) | Adj. Rule (cm) | ||
|---|---|---|---|---|---|---|---|---|---|---|
| Up | Down | Up | Down | |||||||
| Pannerdense kop | 867.22 | 867.5-878.6 | 700 | 280 | 30 | -450 | -425 | -425 | ||
| Nijmegen | 884.87 | 867.5-893 | 516 | 280 | 30 | -266 | -270 | -270 | ||
| Dodewaard | 901.375 | 893-914 | 366 | 280 | 30 | -116 | -100 | -100 | ||
| Tiel | 913.25 | 914-930 | 255 | 280 | 30 | -5 | +10 | +10 | ||
| Zaltbommel | 935 | 930-952.5 | 81 | 338 | 30 | +227 | +227 | +227 | ||
| Dalem (Vuren) | 952 | 930-952.5 | 31 | 397 | 30 | +336 | +366 | +366 | ||
Nederrijn / Lek
| Name | KM | Section | OLR/OLW (cm) | TuOLR (cm) | Official Safety Margin (cm) | Official Rule (cm) | Correction (cm) | Adj. Rule (cm) | ||
|---|---|---|---|---|---|---|---|---|---|---|
| Up | Down | Up | Down | |||||||
| IJsselkop (Nederrijn) | 878.46 | 878.6-891.0 | 683 | 280 | 30 | -433 | -445 | -445 | ||
| Driel boven | 891.17 | 891.0-891.7 | 683 | 290 | 30 | -423 | -423 | -423 | ||
| Driel beneden | 891.75 | 891.7-922.0 | 600 | 350 | 30 | -280 | -300 | -300 | ||
| Amerongen boven | 922.02 | 922.0-922.5 | 600 | 519 | 30 | -111 | -111 | -111 | ||
| Amerongen beneden | 922.54 | 922.5-939.8 | 255 | 350 | 30 | +65 | +65 | +65 | ||
| Culemborg brug | 939.805 | 939.8-946.6 | 255 | 367 | 30 | +82 | +82 | +82 | ||
| Hagestein boven | 946.64 | 946.6-949.1 | 255 | 435 | 30 | +150 | +150 | +150 | ||
| Hagestein beneden | 947.11 | 949.1-971.6 | -49 | 315 | 30 | +334 | +334 | +334 | ||
| Schoonhoven | 971.585 | 971.6-988.0 | -44 | 350 | 30 | +364 | +364 | +364 | ||
IJssel
| Name | KM | Section | OLR (cm) | TuOLR (cm) | Official Safety Margin (cm) | Official Rule (cm) | Correction (cm) | Adj. Rule (cm) | ||
|---|---|---|---|---|---|---|---|---|---|---|
| Up | Down | Up | Down | |||||||
| IJsselkop (IJssel) | 878.46 | 867-903 | 683 | 250 | 30 | -463 | -480 | -480 | ||
| Doesburg | 903.015 | 903-931 | 452 | 250 | 30 | -232 | -230 | -230 | ||
| Zutphen | 929.3 | 930-931 | 262 | 250 | 30 | -42 | -20 | -20 | ||
| Deventer | 945.03 | 931-981 | 142 | 250 | 30 | +78 | +100 | +100 | ||
| Zwolle, IJssel (Katerveer) | 980.75 | 981-994 | -10 | 300 | 30 | +280 | +280 | +280 | ||
| Kampen | 994.495 | 994-1005 | -35 | 337 | 30 | +342 | +342 | +342 | ||
Donau
| Name | KM | Section | RNW (cm) | TuRNW (cm) | Official Safety Margin (cm) | Official Rule (cm) | Correction (cm) | Adj. Rule (cm) | ||
|---|---|---|---|---|---|---|---|---|---|---|
| Up | Down | Up | Down | |||||||
| Kelheim | 2410 | 2415-2399 | 250 | 290 | 30 | +10 | +10 | +10 | ||
| Oberndorf | 2397 | 2397-2380 | 170 | 290 | 30 | +90 | +90 | +90 | ||
| Schwabelweis | 2377 | 2380-2355 | 292 | 290 | 30 | -32 | -32 | -32 | ||
| Pfatter | 2351 | 2354-2330 | 310 | 290 | 30 | -50 | -50 | -50 | ||
| Pfelling (Straubing Hafen Sand) | 2312.3 | 2322-2311.5 | 290 | 265 | 30 | -55 | -55 | -55 | ||
| Pfelling | 2306 | 2311.5-2290 | 290 | 200 | 30 | -120 | -130 | -130 | ||
| Deggendorf | 2284 | 2290-2282 | 210 | 200 | 30 | -40 | -40 | -40 | ||
| Hofkirchen | 2257 | 2282-2231 | 207 | 200 | 30 | -37 | -45 | -40 | ||
| Passau Donau | 2227 | 2231-2204 | 415 | 270 | 30 | -175 | -175 | -175 | ||
Draught, loading depth and payload
How do you calculate how deep an inland vessel may load at the current water level?
The basis is always: current gauge reading of the governing gauge + a rule of thumb (for example gauge Kaub + 83 cm) = maximum draught. The rule of thumb follows from the guaranteed channel depth below a reference water level (GlW on the Rhine, OLR in the Netherlands, RNW on the Danube) minus a safety margin and any Fehltiefen, see the questions about the official rule of thumb and the safety margin. In practice, an additional correction is applied per gauge, because the official calculation is based on the shallowest point across the full channel width, see the question about corrections. This site calculates all of this automatically for every gauge on the route, using both the official calculation rule and the practical corrections, based on the current water levels and forecasts.
How is the maximum draught of an inland vessel officially calculated (official rule of thumb)?
This is obtained based on the standard calculation for determining the maximum draft of a vessel as recommended by the German government and various other institutions. An example calculation: The Kaub gauge has a GlW (Equivalent Water Level) of 77 cm and a "Tiefe unter GlW" (Depth below GlW) of 190 cm and no Fehltiefen. This means that when the Kaub gauge reads 77 cm, the guaranteed fairway depth over the entire marked fairway is 190 cm.
In addition, a safety margin (also known as Under Keel Clearance or UKC) must be maintained between the bottom of the vessel and the riverbed. For most gauges, a margin of 30 cm is used, a figure mentioned by, for example, Platform Zero Accidents or when obtaining your Rhine or Danube patent. However, this is not a universally established rule. The Swiss government, for instance, recommends a stricter safety margin of 40 cm.
Therefore, when Kaub is at 77 cm and no Fehltiefen are published on Elwis Fehltiefen, the maximum draft according to the official calculation is 190 cm − 30 cm = 160 cm.
When Kaub has a different value than this 77 cm, the difference must be added: Current gauge level - GlW + Depth below GlW -Fehltiefe − safety margin = maximum draft. For example, with a gauge level of 50 cm: 50 cm − 77 cm + 190 cm − 30 cm = 133 cm maximum draft according to the "official" calculation.
From this, the official rule of thumb can also be calculated as follows: Depth below GlW - GlW - Fehltiefe - safety margin = official rule of thumb.
For Kaub, this is: 190 - 77 - 30 = 83 cm. So, Kaub + 83 cm is the official rule of thumb.
However, the safety margin is a somewhat vague concept, as it is not universally established.
The complexity of determining the correct margin is highlighted by Platform Zero Accidents, which states (quote):
"For safe navigation, it is necessary that the draft of the vessel is less than the water depth. A safety margin (UKC) must be maintained. How large this margin should be has not yet been determined. However, German jurisprudence shows that a clearance of 20 cm is acceptable for a sand or gravel bottom, but that these 20 cm are certainly not sufficient for a tanker on a route with a rocky bottom. The determination of the clearance depends significantly on the 'good seamanship' of the captain and varies between 20 and 40 cm."
This distinction is not insignificant: the riverbed at Kaub on the Rhine and Hofkirchen on the Danube consists of rock. Contact with the bottom can quickly cause a leak, requiring a larger margin (to the bottom!, not to the guaranteed fairway depth, see "corrections"), whereas most other stretches have a sandy bottom, where grounding usually does not lead to damage.
This "safety margin" is intended to account for the effect of "squat" ("Absunk"), where a moving vessel sinks deeper into the water than its draft when stationary. Squat can easily exceed 30 cm, especially when meeting or passing other vessels in shallow spots, and sometimes reaches up to 70 cm, as numerical simulations by MARIN have shown. It increases quadratically with the speed through the water and is influenced by the vessel's dimensions (wider vessels have more squat, longer vessels less). Because it depends on the speed through the water, downstream vessels generally experience less squat than upstream vessels. Squat also increases as water depth decreases, which is why vessels in practice significantly reduce their speed to pass through shallow spots.
In addition, a safety margin (also known as Under Keel Clearance or UKC) must be maintained between the bottom of the vessel and the riverbed. For most gauges, a margin of 30 cm is used, a figure mentioned by, for example, Platform Zero Accidents or when obtaining your Rhine or Danube patent. However, this is not a universally established rule. The Swiss government, for instance, recommends a stricter safety margin of 40 cm.
Therefore, when Kaub is at 77 cm and no Fehltiefen are published on Elwis Fehltiefen, the maximum draft according to the official calculation is 190 cm − 30 cm = 160 cm.
When Kaub has a different value than this 77 cm, the difference must be added: Current gauge level - GlW + Depth below GlW -Fehltiefe − safety margin = maximum draft. For example, with a gauge level of 50 cm: 50 cm − 77 cm + 190 cm − 30 cm = 133 cm maximum draft according to the "official" calculation.
From this, the official rule of thumb can also be calculated as follows: Depth below GlW - GlW - Fehltiefe - safety margin = official rule of thumb.
For Kaub, this is: 190 - 77 - 30 = 83 cm. So, Kaub + 83 cm is the official rule of thumb.
However, the safety margin is a somewhat vague concept, as it is not universally established.
The complexity of determining the correct margin is highlighted by Platform Zero Accidents, which states (quote):
"For safe navigation, it is necessary that the draft of the vessel is less than the water depth. A safety margin (UKC) must be maintained. How large this margin should be has not yet been determined. However, German jurisprudence shows that a clearance of 20 cm is acceptable for a sand or gravel bottom, but that these 20 cm are certainly not sufficient for a tanker on a route with a rocky bottom. The determination of the clearance depends significantly on the 'good seamanship' of the captain and varies between 20 and 40 cm."
This distinction is not insignificant: the riverbed at Kaub on the Rhine and Hofkirchen on the Danube consists of rock. Contact with the bottom can quickly cause a leak, requiring a larger margin (to the bottom!, not to the guaranteed fairway depth, see "corrections"), whereas most other stretches have a sandy bottom, where grounding usually does not lead to damage.
This "safety margin" is intended to account for the effect of "squat" ("Absunk"), where a moving vessel sinks deeper into the water than its draft when stationary. Squat can easily exceed 30 cm, especially when meeting or passing other vessels in shallow spots, and sometimes reaches up to 70 cm, as numerical simulations by MARIN have shown. It increases quadratically with the speed through the water and is influenced by the vessel's dimensions (wider vessels have more squat, longer vessels less). Because it depends on the speed through the water, downstream vessels generally experience less squat than upstream vessels. Squat also increases as water depth decreases, which is why vessels in practice significantly reduce their speed to pass through shallow spots.
How large should the safety margin (under keel clearance/UKC) under an inland vessel be?
The safety margin (also known as Under Keel Clearance, UKC) is the distance that should be maintained between the bottom of the vessel and the riverbed. For most gauges a margin of 30 cm is used; some recommendations (e.g. certain authorities) suggest a stricter margin of 40 cm. The required margin depends on vessel size, speed and local conditions.
Why does the draught in practice deviate from the official calculation (corrections)?
This term refers to the adjustments made to the official draft calculation rules, making the significant difference between theory and practice visible. The main reason for these large corrections, especially on the Rhine, lies in the quality and type of information provided by the authorities compared to other rivers like the Danube.
On the Austrian Danube, the service Via Donau publishes all shallow spots with a clear map. They provide information on both the depth in the marked, full channel and the depth in the unmarked deepest gully (which has a minimum width for one-way traffic of a 4-barge push tow). With this precise information, the recommended safety margin of 30-40 cm is applied to the minimum depth in the deepest gully.
This is a huge difference from the Rhine. Here, the German and Dutch authorities only provide the minimum guaranteed depth across the full channel. This officially forces captains to apply the 30 cm clearance to the shallowest possible point, even if they know the deepest gully is much deeper. This official method is why captains on the Rhine have sometimes developed relatively large "corrections" of over 40 cm in the case of Oestrich, as the authorities do not always succeed in providing genuinely useful information to the skipper about the deepest gully. However, sometimes skippers sail with less draft than this "official" calculation method suggests, as in the case of Koblenz (often +130 instead of +140). This clearly shows how large the difference is between theory and practice in the eyes of the skipper.
During low water, skippers actively try to avoid known (but officially unpublished) shallow spots. Upstream vessels have the flexibility to choose the best side of the river (with exceptions) and seek out the deepest parts, while being officially required to leave a suitable path for downstream traffic. The guaranteed channel width of 120 (above the Moselle confluence) to 150 (below the Moselle confluence) meters on the Rhine is often only needed for very large convoys in two-way traffic; most ships can pass with much less space, especially in one-way traffic. This allows upstream vessels in particular to load deeper than officially permitted, although downstream vessels experience less squat, which can partially compensate for this. The corrections can be substantial, with dry cargo ships loading up to 70 cm deeper during extremely low water, so even 40 cm deeper than the channel actually allows. For example, instead of the official "Kaub gauge + 83 cm," captains might use "Kaub gauge + 120-125 cm" during extremely low water, also because all ships are maximally loaded and reduce their speed on the dry sections, causing less mutual squat. During the record low water of 2018, when the Kaub gauge was at 27 cm, this made the difference between an unworkable draft of 110 cm (for many "modern" Rhine ships) and a manageable draft of 150 cm. However, it remains a risk, as you become dependent on local knowledge, that of your colleagues, and their collegiality. This does not really apply to many tankers, though. BASF or Shell, for example, do not require them to load deeper than the official rules of thumb. Tankers are already heavier because of their tanks and double hull, so they suffer relatively more from low water than dry cargo ships. This is better regulated on the Danube, where it is legally required to wait below shallows so that everyone can pass through the deepest gully with minimal squat, and "loading deeper than officially permitted" is not really a thing there.
On the Austrian Danube, the service Via Donau publishes all shallow spots with a clear map. They provide information on both the depth in the marked, full channel and the depth in the unmarked deepest gully (which has a minimum width for one-way traffic of a 4-barge push tow). With this precise information, the recommended safety margin of 30-40 cm is applied to the minimum depth in the deepest gully.
This is a huge difference from the Rhine. Here, the German and Dutch authorities only provide the minimum guaranteed depth across the full channel. This officially forces captains to apply the 30 cm clearance to the shallowest possible point, even if they know the deepest gully is much deeper. This official method is why captains on the Rhine have sometimes developed relatively large "corrections" of over 40 cm in the case of Oestrich, as the authorities do not always succeed in providing genuinely useful information to the skipper about the deepest gully. However, sometimes skippers sail with less draft than this "official" calculation method suggests, as in the case of Koblenz (often +130 instead of +140). This clearly shows how large the difference is between theory and practice in the eyes of the skipper.
During low water, skippers actively try to avoid known (but officially unpublished) shallow spots. Upstream vessels have the flexibility to choose the best side of the river (with exceptions) and seek out the deepest parts, while being officially required to leave a suitable path for downstream traffic. The guaranteed channel width of 120 (above the Moselle confluence) to 150 (below the Moselle confluence) meters on the Rhine is often only needed for very large convoys in two-way traffic; most ships can pass with much less space, especially in one-way traffic. This allows upstream vessels in particular to load deeper than officially permitted, although downstream vessels experience less squat, which can partially compensate for this. The corrections can be substantial, with dry cargo ships loading up to 70 cm deeper during extremely low water, so even 40 cm deeper than the channel actually allows. For example, instead of the official "Kaub gauge + 83 cm," captains might use "Kaub gauge + 120-125 cm" during extremely low water, also because all ships are maximally loaded and reduce their speed on the dry sections, causing less mutual squat. During the record low water of 2018, when the Kaub gauge was at 27 cm, this made the difference between an unworkable draft of 110 cm (for many "modern" Rhine ships) and a manageable draft of 150 cm. However, it remains a risk, as you become dependent on local knowledge, that of your colleagues, and their collegiality. This does not really apply to many tankers, though. BASF or Shell, for example, do not require them to load deeper than the official rules of thumb. Tankers are already heavier because of their tanks and double hull, so they suffer relatively more from low water than dry cargo ships. This is better regulated on the Danube, where it is legally required to wait below shallows so that everyone can pass through the deepest gully with minimal squat, and "loading deeper than officially permitted" is not really a thing there.
What is the Abladetiefe at GlW?
For this section, the German government provides an "Abladetiefe bei GlW" (loading depth at equivalent water level) instead of a "Fahrinnentiefe bei GlW" (channel depth at equivalent water level). This means that a safety margin is already included, so the draft can be equal to the Abladetiefe, plus or minus the difference of the water level to the GlW, without taking an additional safety margin into account, as is the case with most other gauges.
How much cargo can an inland vessel carry during low water?
That depends on the vessel and on the available draught on the limiting stretch of the journey. The payload of an inland vessel scales roughly linearly with draught between the empty draught and the maximum draught. A large Rhine vessel with a maximum draught of 3.5 metres and an empty draught of just over 1 metre loses about 80% of its payload at a permitted draught of 150 cm (as during the record low water of 2018 at Kaub). Smaller vessels with a lower maximum draught lose relatively less, which is why smaller vessels are often said to be better suited for low water. In addition, smaller vessels or low-water-optimised larger vessels are built lighter, so that empty they sit only 70 cm deep. As a result, during extreme low water they can at some point carry more than double what comparable, traditionally heavily built vessels can. On the Cargo Capacity tab of this site, you can calculate per vessel type (or for your own vessel) how much tonnage can be loaded at the current maximum draught.
What is the low-water surcharge (Kleinwasserzuschlag)?
The low-water surcharge, or Kleinwasserzuschlag, is a surcharge on the freight price that applies once an agreed gauge (for example Kaub or Duisburg-Ruhrort) drops below an agreed value. Because a vessel can only load part of its normal tonnage during low water while the costs per trip (crew, fuel, capital) remain almost the same, the cost per tonne rises. The surcharge compensates for this and is usually contractually fixed as a percentage or amount per tonne per centimetre that the gauge reading is below the agreed threshold. During extreme low water the total freight price per tonne can therefore amount to a multiple of the normal level, partly because more vessel space is then needed for the same amount of cargo and the spot market becomes tight, reinforced further by push boat operators stopping operations entirely.
Reference water levels and terms (GlW, OLR, RNW, MGD)
What are GlW, OLR and RNW (reference water levels for low water)?
The Equivalent Water Level (Rhine, Germany), Agreed Low River Water Level (Netherlands), and Regulatory Low Water Level (Danube) are statistically determined reference water levels used to calculate the available or desired water depths in a river. It is an internationally agreed standard for the Rhine and Danube, based on a discharge that is, on average, undercut on only 20 days per year. The target channel depth (TuGlW, TuOLR, TuRNW) is based on this GlW/OLR/RNW. For example, the current valid GlW (as of 2022) for the Cologne gauge is a level of 1.39 meters. This means that at a gauge reading of 1.39 meters, a channel depth of 2.50 meters is aimed for, although this can be reduced by shallows published by Elwis: Fehltiefen. The actual available channel depth at, for example, the Deutzer Platte can be calculated as follows:
Current Cologne gauge + 1.11 meters − Fehltiefe/shallow.
The Regulatory Low Water Level (RNW) is practically equivalent to the GlW and OLR: It is a water level whose corresponding water discharge was reached or exceeded on 94% of the days in the period 1961-1990 (thus undercut for only 20 days). In practice, it is functionally equivalent to the GlW, but it is the term used on the Danube.
Current Cologne gauge + 1.11 meters − Fehltiefe/shallow.
The Regulatory Low Water Level (RNW) is practically equivalent to the GlW and OLR: It is a water level whose corresponding water discharge was reached or exceeded on 94% of the days in the period 1961-1990 (thus undercut for only 20 days). In practice, it is functionally equivalent to the GlW, but it is the term used on the Danube.
What is the TuGlW (depth below GlW, OLR or RNW)?
This is the guaranteed available river depth within the marked navigation channel when the water level is exactly at the GlW (Equivalent Water Level). For example, if the target depth is 2.50 meters, this is the TuGlW.
What is the Least Sounded Depth (MGD)?
This is a service from the Dutch government that reports the actually measured channel depth in the marked fairway, as the depth below OLR (which is actually an international agreement that is thus simply being violated) is not maintained. Its practical use is often seen as limited, much like the guaranteed depth below GlW or OLR, because it does not specify the exact locations of the shallow spots. For example, in the spring of 2025, a shallow was discovered on the Waal in the fairway. The Least Sounded Depth was immediately adjusted by 70 centimeters, while the remaining width of the channel was still more than sufficient. However, this also means that valuable information, such as the depth at the dangerous shallow hard layer near Nijmegen, is lost. This makes it more of a tool to shift responsibility onto the skipper. Dutch regulations are such that a captain can get into legal trouble if they load deeper than the published MGD and subsequently run aground, even if that was caused by someone else's fault and even if they were to adhere to the guaranteed depth below OLR with a 30cm margin, just like in Germany. The peculiar thing, however, is that no safety margin is recommended: as long as you are not loaded deeper than the MGD, it is considered acceptable — which in practice does not really make sense, since a ship always experiences squat. A grounding is therefore still theoretically possible when navigating a stretch that is no deeper than the MGD.
This is also the case on the Boven-IJssel. Experienced skippers know they can often increase their draft by another 15 cm on top of the published MGD, while still maintaining a safe margin to the actual shallows in the deepest gully. This brings the actual draft more in line with the 250 cm channel depth at OLR that Rijkswaterstaat aims for. To do this, however, one must be well aware of the shallows and possibly use the bow thruster regularly to navigate through the deeper outer bend, in addition to waiting for downstream traffic below bends where there is officially no ban on meeting. Ultimately, this is also possible because less channel width is needed at low water than what follows from standard calculations for waterway dimensioning. With an empty ship, you need more space again, but in that case, the shallow inner bends are less of a problem. But here too, loading deeper than the MGD remains a risk, as the depths of the crossings between the bends are not published (the actual shallows), and in the event of a grounding, the captain will be held liable.
This is also the case on the Boven-IJssel. Experienced skippers know they can often increase their draft by another 15 cm on top of the published MGD, while still maintaining a safe margin to the actual shallows in the deepest gully. This brings the actual draft more in line with the 250 cm channel depth at OLR that Rijkswaterstaat aims for. To do this, however, one must be well aware of the shallows and possibly use the bow thruster regularly to navigate through the deeper outer bend, in addition to waiting for downstream traffic below bends where there is officially no ban on meeting. Ultimately, this is also possible because less channel width is needed at low water than what follows from standard calculations for waterway dimensioning. With an empty ship, you need more space again, but in that case, the shallow inner bends are less of a problem. But here too, loading deeper than the MGD remains a risk, as the depths of the crossings between the bends are not published (the actual shallows), and in the event of a grounding, the captain will be held liable.
What does high-water Marke I mean on the Rhine?
Between Marke I and Marke II, restrictions apply: keep midstream (downstream) or middle third (upstream), maintain greater bank clearance if needed and reduce speed; max speed 20 km/h (24 km/h in the gorge section); VHF radio required from Marke I (muscle‑powered small craft excluded); fast vessels must not sail. Details: https://www.elwis.de/DE/Schifffahrtsrecht/Binnenschifffahrtsrecht/RheinSchPV/Zweiter-Teil/Kapitel-10/10-01/10-01-node.html
What does high-water Marke II (HSW) mean on the Rhine?
When the reference gauge reaches/exceeds Marke II (or HSW), navigation in that section is prohibited (exception: crossing traffic). Details: https://www.elwis.de/DE/Schifffahrtsrecht/Binnenschifffahrtsrecht/RheinSchPV/Zweiter-Teil/Kapitel-10/10-01/10-01-node.html
Gauges and bottlenecks on the Rhine
What does the gauge reading (value) of a gauge mean?
This is the current water level relative to its zero point (PZG - Pegelnullpunkt). This value is not the same as the available channel depth or a ship's draft. The value can even be negative.
What is the bottleneck at gauge Kaub?
Kaub is the most famous bottleneck on the Rhine. The shallows here consist of rock and gravel. However, what exactly counts as the real bottleneck depends on the water level. At low water, the Kaub section is seen as the actual bottleneck, while at average water levels it is Oestrich. This is because the river in the Oestrich section is wide and needs more 'water' to raise the level by x cm than in the narrow Kaub section. The bad spots include the Geisenrücken fairway (though this has improved since they started milling off the rocks), the Jungferngrund, where mainly downstream traffic runs the risk of grounding if they take the bend too tight. A similar shallow is located opposite the Bacheracher Wert on the corner (Wirbeley/below Hotel Rheingold), where downstream traffic should also steer well clear of the red buoy. The biggest bottleneck that cannot be bypassed is at Lorch, where a shallow of rocks extends across the full width of the fairway. However, this shallow is located in the section where the GlW of Oestrich is valid (and so Oestrich (or Bingen) must also be used here to calculate the current depth/permissible draught), see also the bottleneck profile.
See also the depth charts of the Dutch and German Rhine branches on pdf v30-06-2026.
See also the depth charts of the Dutch and German Rhine branches on pdf v30-06-2026.
What is the bottleneck at Oestrich?
There are quite a few shallows in the Oestrich section. One of the most dangerous is the one at Lorch due to its rocky bottom, see also the bottleneck profile from the WSA about this. According to the Elwis Depth Atlas, the bottom here is at approx. Oestrich + 130/140. Additionally, near Bingen at the junction with the Rüdersheimer fairway and the harbour entrance, there is a shallow (mainly on the left side of the fairway), consisting of gravel. Furthermore, between km 524.5 and km 526 there is a shallow on the right side of the fairway (gravel), here too the marked channel is drawn completely over it. Upstream traffic must sail close to the left bank here (along the training wall) (that's where the most water is), so that downstream traffic can avoid the shallow as much as possible. A similar shallow in the inner bend is located between km 516.3 and km 519.8 near the Oestrich-Winkel ferry on the right bank. For upstream traffic, it is also best here to sail close along the green buoys (there it is deepest) so that downstream traffic can avoid the shallow as much as possible. Additionally, at the entrance to the Kleine Gies there is also a fairly long shallow. Between 515 and 515.8 there is also a shallow on the right bank on the corner, here upstream traffic must keep to the left bank as much as possible so that downstream traffic can avoid the shallow.
See also the depth charts of the Dutch and German Rhine branches on pdf v30-06-2026.
See also the depth charts of the Dutch and German Rhine branches on pdf v30-06-2026.
What is the rule of thumb for gauge Koblenz?
It is often said (especially by a certain company that sells commercial depth charts and has an interest in this) that the official rule of thumb for Koblenz is only + 103 cm. However, this is only the case above the Moselle mouth where the Depth below GlW (TuGlW) is 210 cm; below the Moselle mouth it is 250 cm, resulting in an official rule of thumb there of + 143 cm (see Hinweis Fahrinne). However, people often sail with + 130 cm, but just as well with + 160 cm, it just depends on how much of a hurry you are in. There are no major bottlenecks like the Deutzer Platte, but rather very long shallow stretches where meeting other traffic can draw away just a little too much water if they don't adjust their speed a bit.
See also the depth charts of the Dutch and German Rhine branches on pdf v30-06-2026.
See also the depth charts of the Dutch and German Rhine branches on pdf v30-06-2026.
What is the bottleneck at Bonn?
The biggest bottleneck here is the Wichelsgrund, just downstream of the Kennedy Bridge in the middle of the fairway, just like the Deutzer Platte across the full width of the fairway, but deeper. Officially, the bottom lies at Bonn Gauge + 108 cm.
See also the depth charts of the Dutch and German Rhine branches on pdf v30-06-2026.
See also the depth charts of the Dutch and German Rhine branches on pdf v30-06-2026.
What is the bottleneck at Cologne (Deutzer Platte)?
The shoal at Cologne is the biggest bottleneck for ships sailing to e.g. the Moselle. The 'Deutzer Platte' lies between the Deutzer Brücke and the Severinsbrücke across the full width of the fairway; there is no real way around it. Officially, the bottom here should be at Cologne Gauge + 111 cm, but there are regularly 'Fehltiefen' (depth deficits). See also Elwis Shallow Depths (unfortunately not very clear, but that's the best available in Germany). According to the Bottleneck Profile, the latest soundings are published via the Depth Atlas, however, this has not happened since 2020 so it is nothing more than an empty promise...
See also the depth charts of the Dutch and German Rhine branches on pdf v30-06-2026.
See also the depth charts of the Dutch and German Rhine branches on pdf v30-06-2026.
What is the bottleneck at Düsseldorf?
The bottleneck at Düsseldorf is mainly the shoal in the middle/right side of the fairway in the bend upstream of the Rheinkniebrücke. Currently, work is being done to deepen the fairway from 250 cm below GlW [Equivalent Water Level] to 280 cm below GlW (same as the downstream sections Duisburg, Wesel etc.). For the time being, the outer bend is the shallowest in any case. It is best to sail on the left bank, keeping approx. 100m distance for the first two groynes upstream of the bridge (well within the official fairway), from the third groyne and further upstream at approx. 50m distance (from the third groyne outside the fairway). The bottom here is at approx. Düsseldorf gauge + 220 cm, while in the outer bend it is officially Düsseldorf + 159 cm 'deep', if not less, as has often been the case lately. See also Elwis Shallow Depths (unfortunately not very clear, but that's the best available in Germany).
See also the depth charts of the Dutch and German Rhine branches on pdf v30-06-2026, but note that these depth charts of Düsseldorf are outdated; the once quite deep 'channel' through the outer bend practically no longer exists, see figure: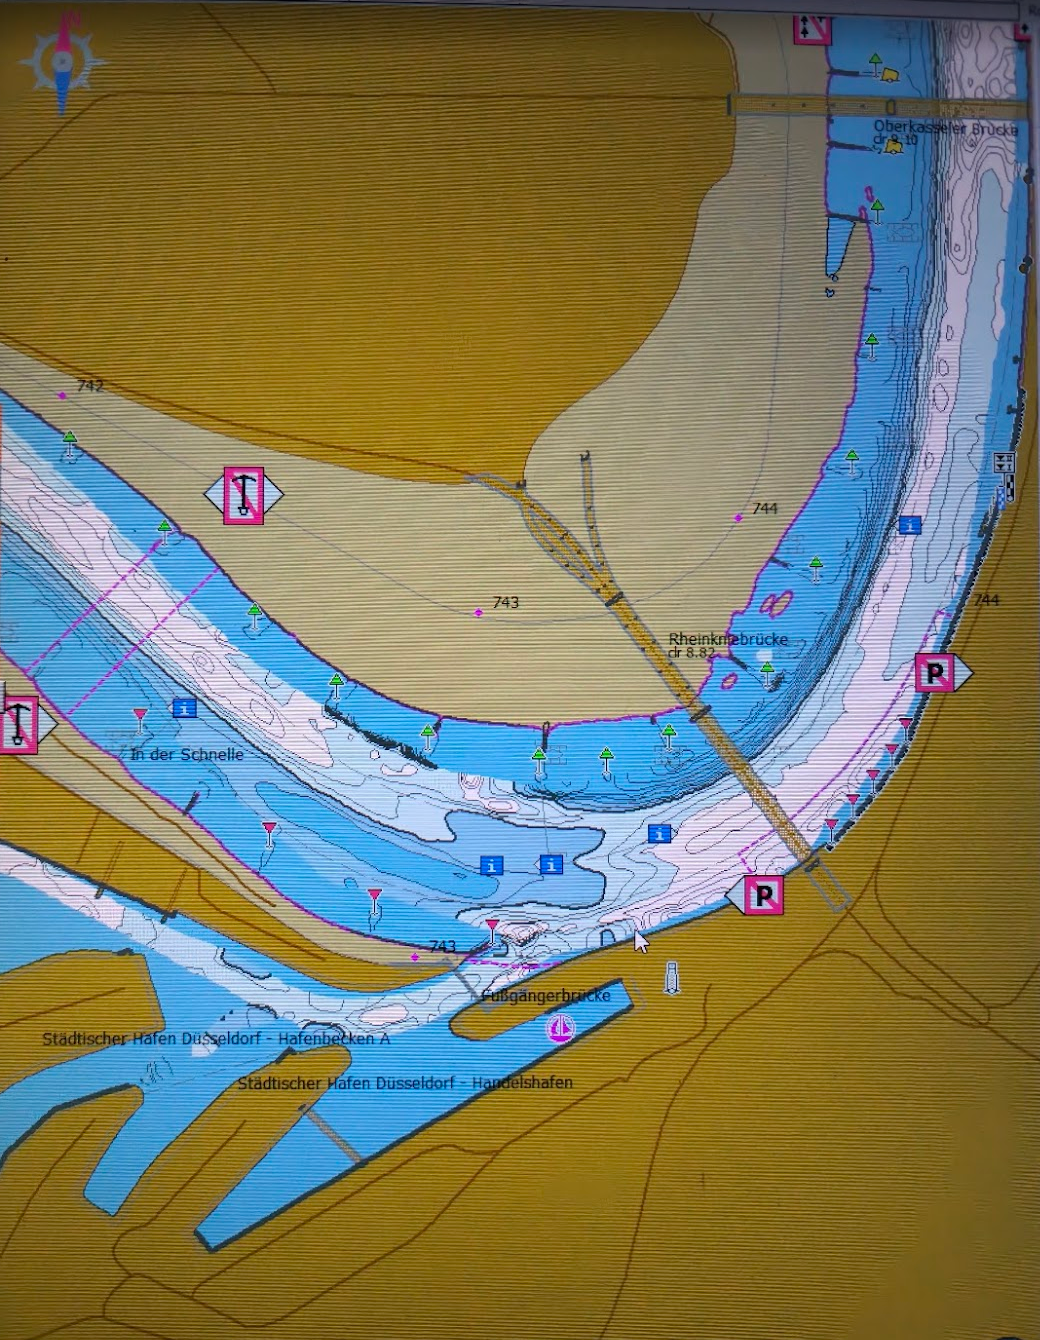
See also the depth charts of the Dutch and German Rhine branches on pdf v30-06-2026, but note that these depth charts of Düsseldorf are outdated; the once quite deep 'channel' through the outer bend practically no longer exists, see figure:
What is the bottleneck at Nijmegen (the hard layer)?
The shallow section near Nijmegen is the biggest bottleneck for vessels bound for Duisburg. The main problem is the 'hard layer' of riprap dumped on the riverbed between km 883.3 and 885 to widen the fairway for six-barge push-tows. Several vessels have already sprung a leak here. The shallowest part lies at km 884.4 on the left bank in the outer bend (bottom at Gauge Nijmegen - 220 cm), while there is approx. 20 cm more water on the right bank (bottom at Gauge Nijmegen - 200 cm). It is therefore best to cross over from the right to the left bank starting at km 885.4. This is because between km 885.3 and km 886.5 there is an even shallower section on the right bank under the bridge 'De Oversteek' (bottom at Gauge Nijmegen - 280 cm), though this is just sand. On the ECDIS chart, the fairway is drawn completely over this shallow, whereas it is much deeper outside the fairway in the dark blue area on the left bank. Between km 885.4 and km 877.5, the deepest water is on the right bank, up to the shallow section on the right between km 876.3 and 877.3 (bottom at Gauge Nijmegen - 280 cm). Here too, the fairway is drawn completely over the shallow, while it is much deeper outside the fairway on the left bank from the green buoy at km 877.5. Upstream of this is the Erlecom bend, which is full of submerged groynes at the bottom at a minimum depth of Gauge Nijmegen - 200 cm. Vessels have sprung leaks here during overtaking maneuvers because the squat can increase up to 70 cm.
See also the depth charts of the Dutch (and German) Rhine branches at pdf v30-06-2026.
See also the depth charts of the Dutch (and German) Rhine branches at pdf v30-06-2026.
What rules apply at Basel-Rheinhalle (high water and vessel length)?
Upstream of Birsfelden Lock and below the Mittlere Rheinbrücke, HSW IIa (820 cm, 2750 m³/s) of Basel-Rheinhalle applies. Between the outer harbour of Birsfelden Lock and the Mittlere Rheinbrücke, HSW IIb (790 cm, 2580 m³/s) applies. In addition, for ships longer than 110 m, it depends on the water level whether they are allowed to navigate this section:
For vessels and push convoys with a length of more than 110 m, the maximum permissible length is:
a. at a water level up to 6.20 m at the Basel-Rheinhalle gauge:
1. 135 m for vessels in both upstream and downstream navigation,
2. 135 m for push convoys in downstream navigation,
3. 185 m for push convoys in upstream navigation;
b. at a water level up to 6.50 m at the Basel-Rheinhalle gauge: 185 m for push convoys in upstream navigation, provided they use tug assistance;
c. upon reaching or exceeding a water level of 6.70 m at the Basel-Rheinhalle gauge: 125 m for all vessels in both upstream and downstream navigation. See also Hochrhein-Polizeiverordnung BAV.
### Warning: HVZ Baden-Württemberg forecast
Warning. The forecast may contain inaccuracies. The forecast data for this gauge is (partly) sourced from the Hochwasservorhersagezentrale Baden-Württemberg. The small chart you see when clicking the hyperlink for this gauge is the only format in which this public authority publishes its forecast. Unfortunately, the digitisation has only resulted in a very low‑resolution image. The algorithm that converts that image back into numeric values for this table may sometimes be wrong because it must OCR axis labels that are also low resolution, and cannot be guaranteed 100% correct. Always verify the original chart if the numbers appear implausible.
For vessels and push convoys with a length of more than 110 m, the maximum permissible length is:
a. at a water level up to 6.20 m at the Basel-Rheinhalle gauge:
1. 135 m for vessels in both upstream and downstream navigation,
2. 135 m for push convoys in downstream navigation,
3. 185 m for push convoys in upstream navigation;
b. at a water level up to 6.50 m at the Basel-Rheinhalle gauge: 185 m for push convoys in upstream navigation, provided they use tug assistance;
c. upon reaching or exceeding a water level of 6.70 m at the Basel-Rheinhalle gauge: 125 m for all vessels in both upstream and downstream navigation. See also Hochrhein-Polizeiverordnung BAV.
### Warning: HVZ Baden-Württemberg forecast
Warning. The forecast may contain inaccuracies. The forecast data for this gauge is (partly) sourced from the Hochwasservorhersagezentrale Baden-Württemberg. The small chart you see when clicking the hyperlink for this gauge is the only format in which this public authority publishes its forecast. Unfortunately, the digitisation has only resulted in a very low‑resolution image. The algorithm that converts that image back into numeric values for this table may sometimes be wrong because it must OCR axis labels that are also low resolution, and cannot be guaranteed 100% correct. Always verify the original chart if the numbers appear implausible.
Water level forecasts
How reliable are water level forecasts (uncertainty band)?
Most water level forecast models have built-in tools to calculate an uncertainty band. The commonly used uncertainty band is the 80% band, which means that 20% of the forecasts (1 in 5) will still fall outside this range and be "wrong." This is unknown to most captains, as standard 4-day forecasts from Elwis typically do not publish these bands and, as shown in the charts, only give a simple ± 10/20 interval, which makes it unclear how confident the model itself actually is. The HVZ of Rheinland-Pfalz and Baden-Württemberg do show this; from it you can better see how confident the models are about how the water level will develop: during dry periods the uncertainty is much smaller than during rainy periods. Forecasts for more than two days are highly dependent on weather predictions (although this also depends on the distance via the river to the rain area). During periods of low water, forecasts predicting a rise due to rain are often overly optimistic because Elwis only publishes the median. This can lead to problems when ships are loaded too deep based on a predicted rise and then cannot pass limiting sections. Therefore, loading a ship based on a forecasted precipitation peak is risky, and it is generally advisable to use the lower end of the forecast's uncertainty band. When the water is falling and no precipitation is expected, the forecasts are usually more accurate, as all the water is already in the system and the biggest uncertainty factor (future precipitation) does not apply. For this reason, the forecasts from HVZ Baden-Württemberg (Maxau, Mannheim, etc.) always have a "no precipitation line" that shows what the forecast would be if no rain were to fall.
Dutch rivers: Waal, IJssel, Nederrijn and Lek
How are water levels and bridge clearances on the Dutch rivers calculated using a model?
NOTE: calculation based on modelled water-level relations. On the free-flowing sections of the Rhine in Germany, the bridge-clearance calculation is simple. The river is divided into reaches, each with an associated high-water gauge with a fixed value for Marke I and Marke II (which, incidentally, differ from the gauges and reaches used to calculate draught). The minimum vertical clearances of the bridges are based on this. Once a gauge reaches Marke II, the clearance equals the clearance at HSW (HSW = Marke II) for the bridges in that reach. Assuming the water surface rises linearly across the whole reach, the clearance can be calculated by taking the difference between the gauge reading and Marke II and adding that difference to the clearance at HSW. In the Netherlands we have no Marke II at which the waterway is closed. A different reference point was therefore chosen, one reached only in very extreme situations: the Maatgevend Hoge WaterStand (MHWS/MHW, design high-water level). For the Rhine branches this corresponds to a discharge of 15,000 m³/s at Lobith -- a discharge that was not even exceeded in 1926 (12,400 m³/s) or 1995 (12,060 m³/s), and is thus in practice an extremely rare situation, unlike Marke II in Germany. The biggest problem, moreover, is that the gauges along the rivers have no established MHWS. So you cannot calculate how far a gauge stands below MHWS in order to add that to the clearance at MHWS. In the Netherlands all measurements and clearances are also given relative to NAP, but on a river this is fairly useless because of the water-surface slope. If the gauge is a few kilometres from the bridge, the water level relative to NAP at the bridge is higher than at the measuring point, so it cannot be used directly to calculate clearances on the rivers. During high water, Rijkswaterstaat therefore publishes the Clearances of governing bridges. We assume they use a water-level model there that gives a water level relative to NAP for every river kilometre at every discharge. This site does the same, using (the results of) the 2024 D-HYDRO model for that purpose -- but these remain models and can therefore deviate from reality. The gauges are always authoritative.
How do OLR and MGD relate at Hagestein-Beneden?
According to the report 'RUIMTE VOOR DE LEK', the guaranteed depth at OLR is 315 cm. In 2012, the OLR at Hagestein Beneden was set at −0.47 m + NAP. This corresponds to a maximum draft of 315 + 47 − 30 (safety margin) = 332 cm at NAP 0.
Rijkswaterstaat also guarantees the following: 'In the river reach Hagestein – Krimpen aan de Lek kmr. 946.850 – kmr. 989.200, at a water level Hagestein Beneden NAP +0.30 m, the MGD is 350 cm.' This implies a guaranteed MGD of about 320 cm at NAP 0.
Because it is permitted to assume the same draft as the published MGD (without an extra safety margin), one can infer that Rijkswaterstaat effectively includes a safety margin of around 40 cm in the MGD. Both approaches therefore converge to a similar maximum draft when using the same safety margin.
Rijkswaterstaat also guarantees the following: 'In the river reach Hagestein – Krimpen aan de Lek kmr. 946.850 – kmr. 989.200, at a water level Hagestein Beneden NAP +0.30 m, the MGD is 350 cm.' This implies a guaranteed MGD of about 320 cm at NAP 0.
Because it is permitted to assume the same draft as the published MGD (without an extra safety margin), one can infer that Rijkswaterstaat effectively includes a safety margin of around 40 cm in the MGD. Both approaches therefore converge to a similar maximum draft when using the same safety margin.
Which gauge do you use for draught on the Boven-IJssel: IJsselkop or Doesburg?
The water level at gauge IJsselkop does not scale linearly with the available depth on the IJssel; this is also reflected by the fact that the MGD at average low water indicates a greater depth than calculated with IJsselkop -460. This rule of thumb aligns better at extremely low water, but gauge Doesburg, conversely, gives a better indication of the currently available depth on the IJsselkop–Twenthekanaal reach at any water level. It is therefore better suited to determine maximum draft on the Upper IJssel than gauge IJsselkop. MGD + 15 is also often used, since shallows on the Upper IJssel are mainly in the dry corners (inside bends) that can be navigated around, and not so much in crossings/furrows.
Danube
What is 'leightering' on the Danube between Regensburg/Straubing and Vilshofen/Passau?
Because the last 70‑km bottleneck between Straubing and Vilshofen on the Danube was never upgraded, a 250 cm loading draft is possible there on average only ~144 days per year. By contrast, the Rhine at Kaub allows this about ~300 days per year, as does the free‑flowing Austrian Danube. As a result, ships often arrive with too much draft and must transship part of the cargo in Regensburg (downstream) or Passau (upstream) onto additional vessels ("leightering") to reduce draft and pass this stretch. Afterwards, the cargo is often reloaded, or—if the destination is near Passau/Regensburg (e.g., Enns or Kelheim)—they proceed together to the discharge port.
Bridge clearances and bridges
How is the bridge clearance calculated?
In Germany the calculation on the free-flowing Rhine is simple: each reach has a high-water gauge with a fixed Marke II/HSW value, and the clearance at HSW is known for every bridge. The current clearance is then: clearance at HSW + (HSW value − current gauge reading). In the Netherlands such a reference point practically does not exist, and bridge heights are published relative to NAP. Because of the river's slope, the water level at the bridge cannot be read directly from a gauge; that is why this site calculates the water surface at the bridge using (the results of) Rijkswaterstaat's D-HYDRO model, see the question about the model-based calculation. On the Bridge Heights tab, all bridges on the route are calculated and compared with the specified vessel height plus safety margin, including forecasts.
Low water and inland shipping
Why aren't inland vessels built for extreme low water?
The European inland navigation fleet is very diverse. Most ships are built for specific canal and lock dimensions and are designed to have an optimal business case over their expected lifespan (often at least 50 years). Since extremely shallow water occurs on average only a few days a year (see, for example, the mere 20 days per year of undercutting used for the agreed low river water level, which is not even considered extremely low water), it is not economical to build ships that are highly optimized for these conditions. They must also be profitable on deeper canals and rivers for the majority of the year. Historically, inland shipping in recent decades transported many bulk goods such as coal, which were mainly needed in winter when water levels were high and could be well-buffered to bridge times of reduced supply capacity. This trend has gradually increased the maximum draft of ships from the 2.5-meter canal standard to as much as 4 meters. In addition, in the period 1980-2010, very few extremely low discharges were measured, as Rijkswaterstaat states in their report 'Determination of Agreed Low River Water Level 2022 for the Dutch Rhine Branches': 'Furthermore, it is noticeable that for the period 1941-1980, relatively low discharges were determined and, related to that, contained many days below the established OLA. For the subsequent period (1981-2010), however, the discharge values are well above the average.'
This has partly led to the fact that during this period of scaling up, it was not considered necessary to build ships and push boats with a low draft, with the result that the minimum draft for ships from this period increases to as much as 2 meters. This has, for example, ensured that during the extremely low water levels of 2018 and 2022, and now again in 2026, all push boats supplying the blast furnaces were no longer deployable and a fallback to the spot market was necessary (especially coupled convoys and 135m ships that take 2 extra barges alongside). This is while on the Danube, push boats are known as the ideal low water solution. This is also partly because push boat operators stick to the Least Sounded Depth (MGD). Once that drops below 1.70 m, they are officially too deep. Spot-market ships do not stick to this and know that you can perfectly well sail tens of centimeters deeper than the MGD if you avoid the bad spots, so they can therefore keep sailing for much longer.
In addition, the following is also mentioned: 'Finally, it can be stated about the last decade (2011-2020) that it is quite close to the established OLA. So despite the extremely dry years 2018-2020 with many low water days, this decade as a whole is actually quite average. It is, by the way, a normal pattern that most low water days occur in a limited number of years. These years are then experienced as extreme, but are part of the hydrological fluctuations that simply occur on the Rhine.'
Although it is still uncertain how the current climate change will quantitatively affect the number of days with very low discharge, it can be stated that extremely low water still occurs too infrequently to be a real business model. The current fleet is practically well adapted to achieve optimal economic returns for more than 94% of the year. It is therefore also unlikely that true low-water ships, such as those on the Elbe, Oder, Danube, or Siberian rivers, will become dominant. The current generation of so-called 'low-water optimized' ships are mainly optimized by saving weight on the hull construction to carry slightly more cargo than their predecessors and especially their propulsion is also adapted so that they can still sail at lower water levels, but they are not designed with a lower maximum draft to reduce capacity fluctuations. This means that even these modern ships still cannot utilize 80% of their maximum payload at extremely low water. As a result, low water will remain a major cause of transport congestion and price increases, because the free market does not pay for the loss that extremely optimized ships will incur during the 94% of the time that water levels are 'high.'
This has partly led to the fact that during this period of scaling up, it was not considered necessary to build ships and push boats with a low draft, with the result that the minimum draft for ships from this period increases to as much as 2 meters. This has, for example, ensured that during the extremely low water levels of 2018 and 2022, and now again in 2026, all push boats supplying the blast furnaces were no longer deployable and a fallback to the spot market was necessary (especially coupled convoys and 135m ships that take 2 extra barges alongside). This is while on the Danube, push boats are known as the ideal low water solution. This is also partly because push boat operators stick to the Least Sounded Depth (MGD). Once that drops below 1.70 m, they are officially too deep. Spot-market ships do not stick to this and know that you can perfectly well sail tens of centimeters deeper than the MGD if you avoid the bad spots, so they can therefore keep sailing for much longer.
In addition, the following is also mentioned: 'Finally, it can be stated about the last decade (2011-2020) that it is quite close to the established OLA. So despite the extremely dry years 2018-2020 with many low water days, this decade as a whole is actually quite average. It is, by the way, a normal pattern that most low water days occur in a limited number of years. These years are then experienced as extreme, but are part of the hydrological fluctuations that simply occur on the Rhine.'
Although it is still uncertain how the current climate change will quantitatively affect the number of days with very low discharge, it can be stated that extremely low water still occurs too infrequently to be a real business model. The current fleet is practically well adapted to achieve optimal economic returns for more than 94% of the year. It is therefore also unlikely that true low-water ships, such as those on the Elbe, Oder, Danube, or Siberian rivers, will become dominant. The current generation of so-called 'low-water optimized' ships are mainly optimized by saving weight on the hull construction to carry slightly more cargo than their predecessors and especially their propulsion is also adapted so that they can still sail at lower water levels, but they are not designed with a lower maximum draft to reduce capacity fluctuations. This means that even these modern ships still cannot utilize 80% of their maximum payload at extremely low water. As a result, low water will remain a major cause of transport congestion and price increases, because the free market does not pay for the loss that extremely optimized ships will incur during the 94% of the time that water levels are 'high.'
Why do inland vessels sail with less cargo during low water?
Because there is no other way: the draught of a loaded vessel may not exceed the available channel depth at the shallowest point of the route, minus a safety margin, or it will run aground. During low water that available depth at bottlenecks such as Kaub, Cologne or Nijmegen is sometimes only 1.2 to 2 metres, while many Rhine vessels fully loaded draw 3 to 4 metres. The vessel is then physically unable to load fully, it would run aground. A vessel sailing 'more than half empty' during low water is therefore usually loaded to the maximum for the conditions. Because each vessel carries less, more vessels are needed for the same amount of cargo, which reduces total transport capacity and causes congestion and higher prices, see also the question about transport costs.
What does low water do to the transport costs and transport capacity of inland shipping?
During low water each vessel can only load part of its normal tonnage (see the question about payload), while the costs per trip remain almost unchanged. The cost per tonne therefore rises sharply, which is passed on via the low-water surcharge (Kleinwasserzuschlag). At the same time, more vessel space is needed for the same amount of cargo, which tightens the spot market and pushes freight prices up further. During extreme low water, such as in 2018 and 2022, the supply of raw materials to factories along the Rhine can fall so far that production has to be reduced. Because the fleet is not designed for extreme low water (see the question about the European fleet) and this only occurs on average a few days to weeks per year, low water remains a structural cause of capacity shortages and price spikes in inland shipping, also because during high water the market is unwilling to pay for extremely low-water-optimised vessels more than 90% of the time.
About this site
This project started as a hobby project because, as inland sailors, we often have to gather our information from many different sources and it is not always clear. It is not affiliated with government agencies or commercial parties, which has the advantage that all information can be presented here without a 'filter', since this website cannot be held liable. However, it is designed so that an attempt is made to always show practical rules alongside the official (calculation) rules from authorities, so the difference is clear and the correct risk assessment can be made.
For the Waal, Lek, Nederrijn and IJssel I have also created depth maps, combined into one document together with the depth maps of the German Rhine. These can be downloaded via pdf v30-06-2026. They are attempted to be updated monthly after Rijkswaterstaat publishes new information on geoweb.rijkswaterstaat.nl.
Since this is the work of a single person who mainly collected the information from personal experience on the rivers and internet sources, there may be mistakes. If you find one, it is much appreciated to report it so it can be corrected. If you have missing information, for example ports with depth or bridge height restrictions, you can always share it so it can be added to the existing list. Suggestions for more or other features are always welcome.
Do you enjoy using this site? Unfortunately, hosting a website is not free. A contribution helps keep it running.
Last updated: 2026-07-17