Loading...
PegelTiefgang
Welcome to the renewed version of PegelTiefgang
Collapse
This project started a few years ago as a hobby project, to work out automatically all the relevant information on water levels, fairway depths, draft and bridge clearances on the Rhine, Waal, Danube, IJssel, Nederrijn and Lek and to gather it in one place, and in doing so to put the focus on what may legally be used as draft and what is used in practice / what is possible. There are several options for the rules of thumb: the “normal” option (e.g. Kaub + 100, Koblenz + 130) and the “deep” option (Kaub + 125, Koblenz + 160), which goes towards the maximum possible, demands caution and local knowledge or depth charts and is mainly used at (extremely) low water.
You can also adjust the rules of thumb yourself, they are saved on your computer or phone. From the correction you can see how much deeper you load than the officially released draft, but take care: this is based on what the waterway authorities ought to guarantee, not on what the actual situation is! On Elwis Fehltiefen you can see in Germany what the actual situation is (for example that on the Deutzer Platte only a fairway depth of gauge Köln + 91 is available at the moment, from which a safety margin of at least 20 cm still has to be deducted). In the Netherlands this is published through the Minst Gepeilde Diepte.
Set your correction profile here:
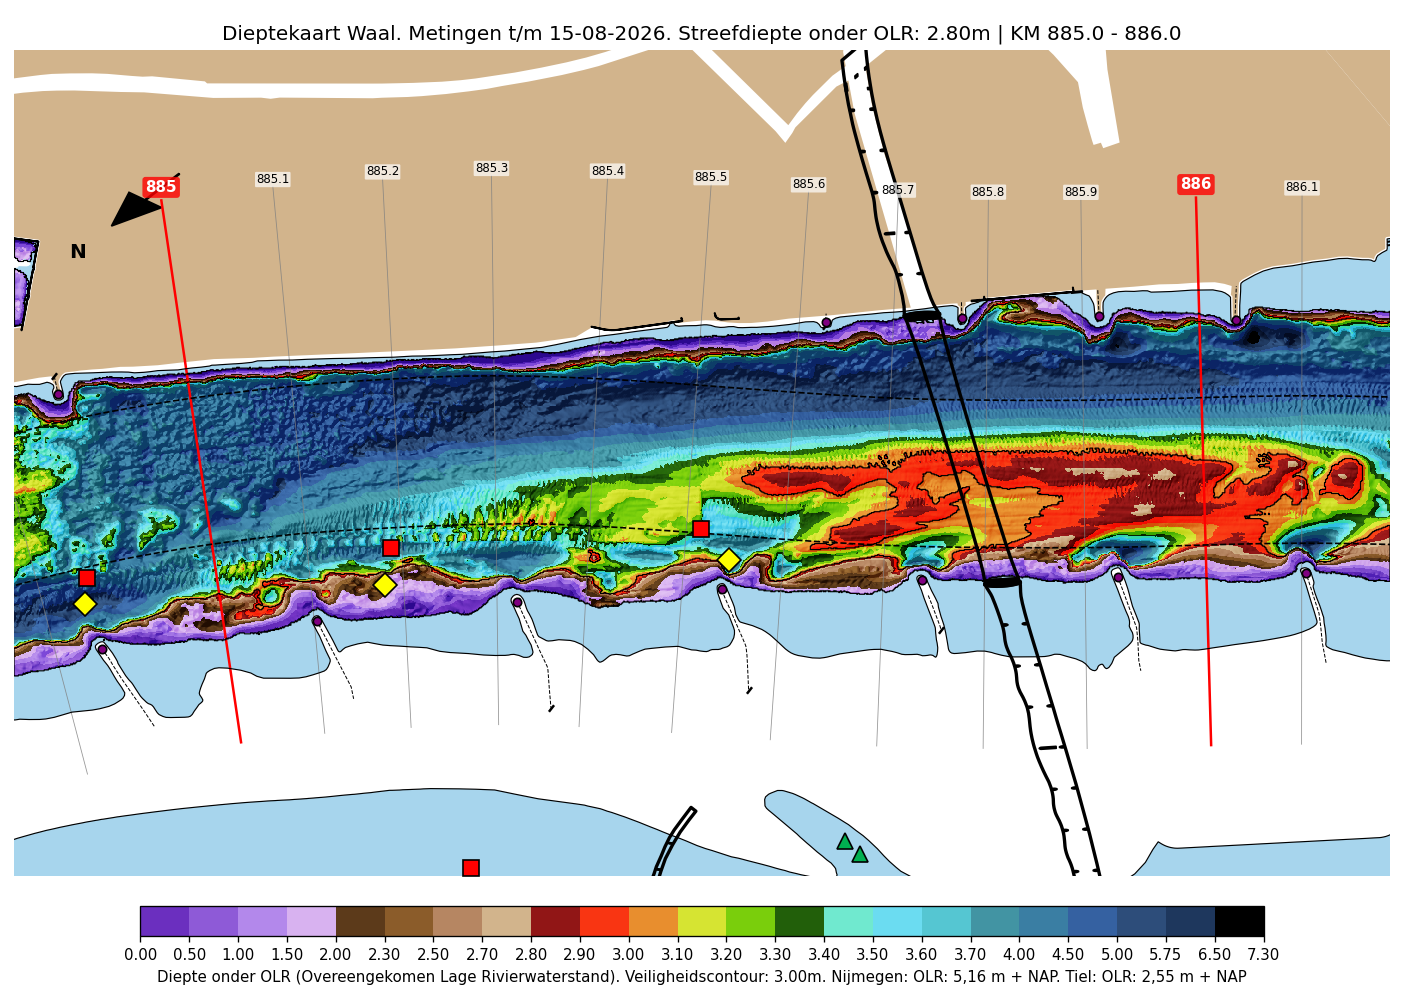
On top of that, as an alternative to Covadem, I also make depth charts for the Dutch rivers myself and combine them with those of the WSV for the German Rhine. For a preview and a download link see Go to the depth charts.
On the home page you see an overview of the current situation on the planned route: the current limiting draft, bridge clearance and the forecasts of various authorities, all combined in one chart.
Under All gauges you see the charts of all the gauges that are retrieved, per river. You can leave rivers and particular gauges out of the overview yourself.
Under High water you can see the relevant gauges and stretches on the route that can be closed by high water when Marke II or HSW is reached. The gauges and stretches are different from the ones used to calculate the draft.
Under Bridges you can see all the current and forecast bridge clearances on the planned route. They are worked out in different ways; certainly in the Netherlands and on the Upper Rhine the calculation for some bridges is hard to carry out by hand.
In the Route Planner (see Plan trip under the selected route on the main page) you can extend the forecast by taking travel time and departure time into your calculation. The route planner works out when you arrive at which gauge or bridge and from that determines, on the basis of the operating mode and the speed, the limiting draft and bridge clearance.
Under Cargo Capacity you can see, from the measurement certificates of many ships, most of which I have sailed on myself, how much cargo they can carry at a given water level or draft and whether they can still sail. That shows, for example, how much the newest generation of low water ships really carries extra compared with the standard ships.
In the Rules of thumb & FAQ various terms are explained that you need in order to understand how official fairway depths, drafts and rules of thumb are calculated, and also other low water, high water and further water level and inland shipping terms, for news media and the curious among others.
Under Settings you can easily adjust various personal settings, though most of this can also be done at the relevant places on the site itself.
Questions, tips, feedback, or found a mistake? That is appreciated! Go to contact