Rijn (NL)
Loading...
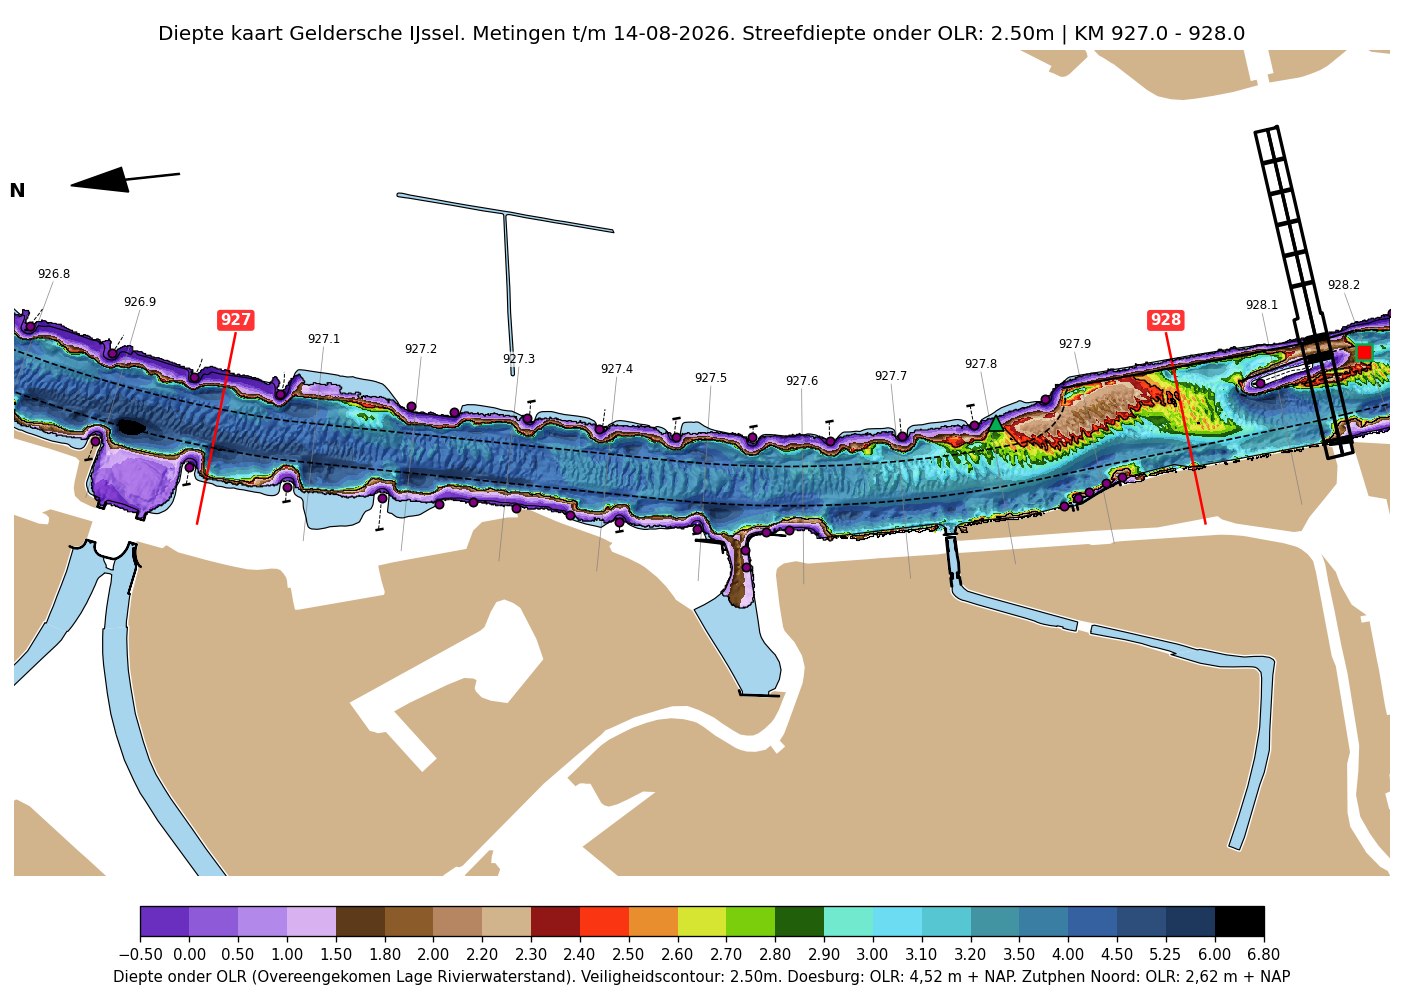
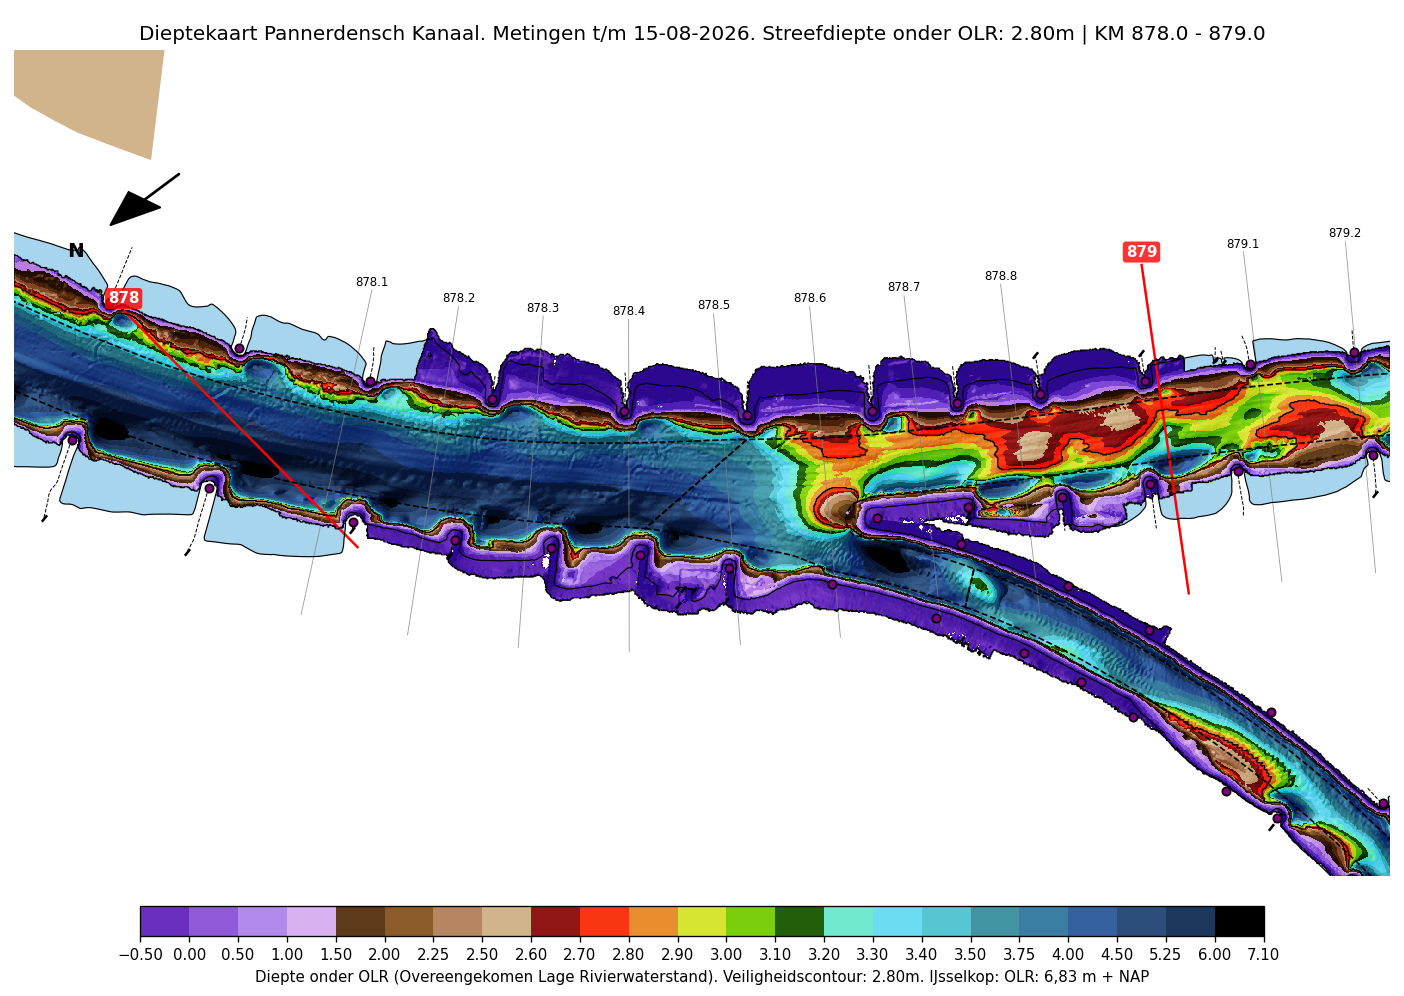
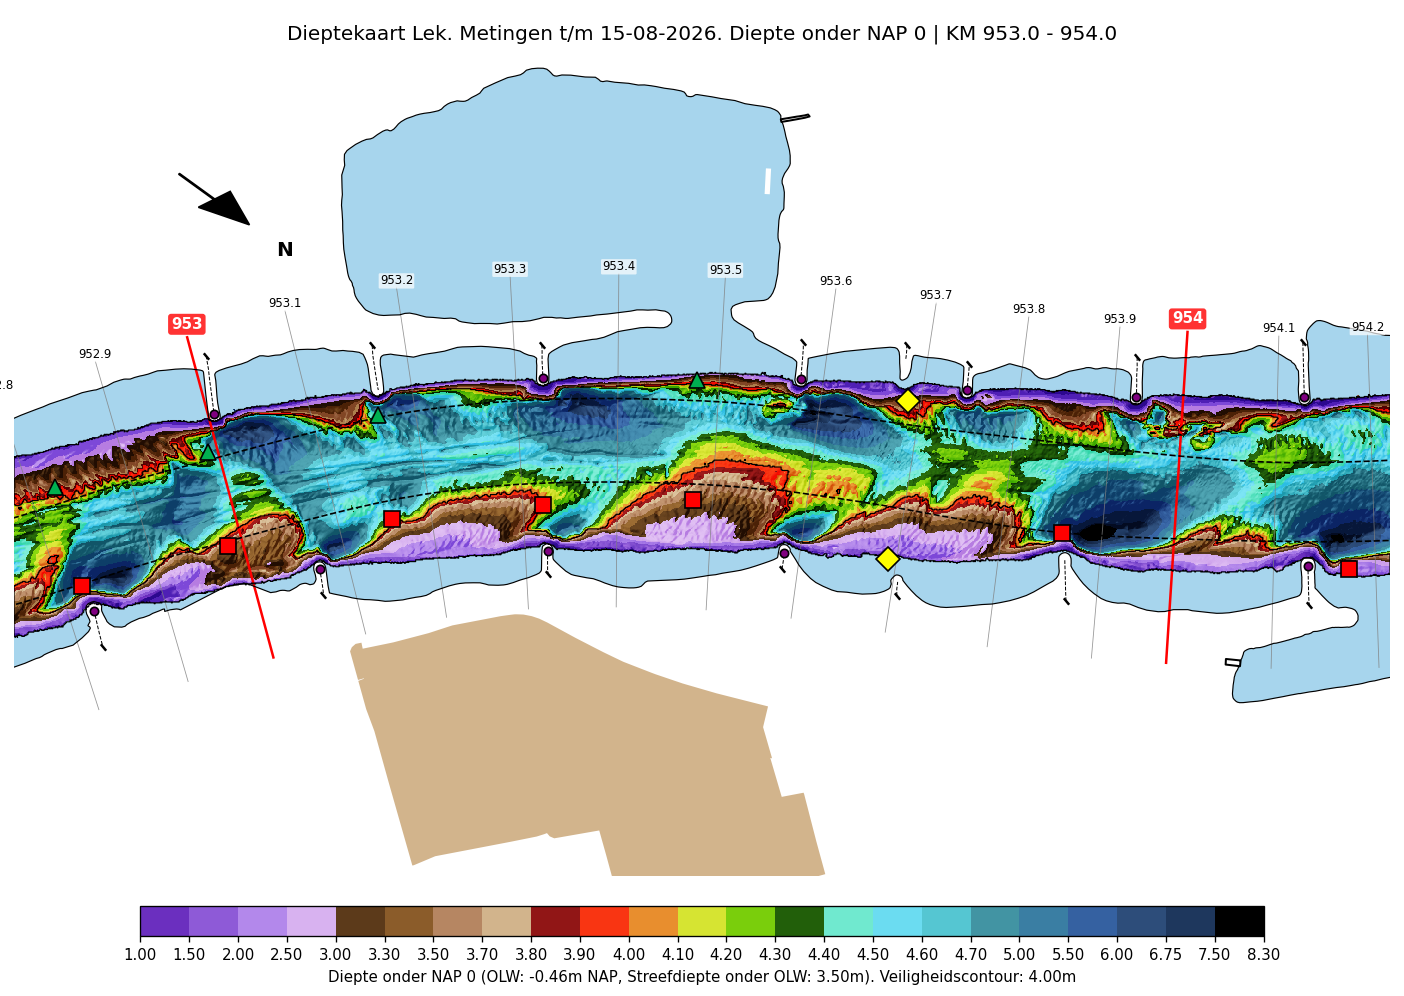
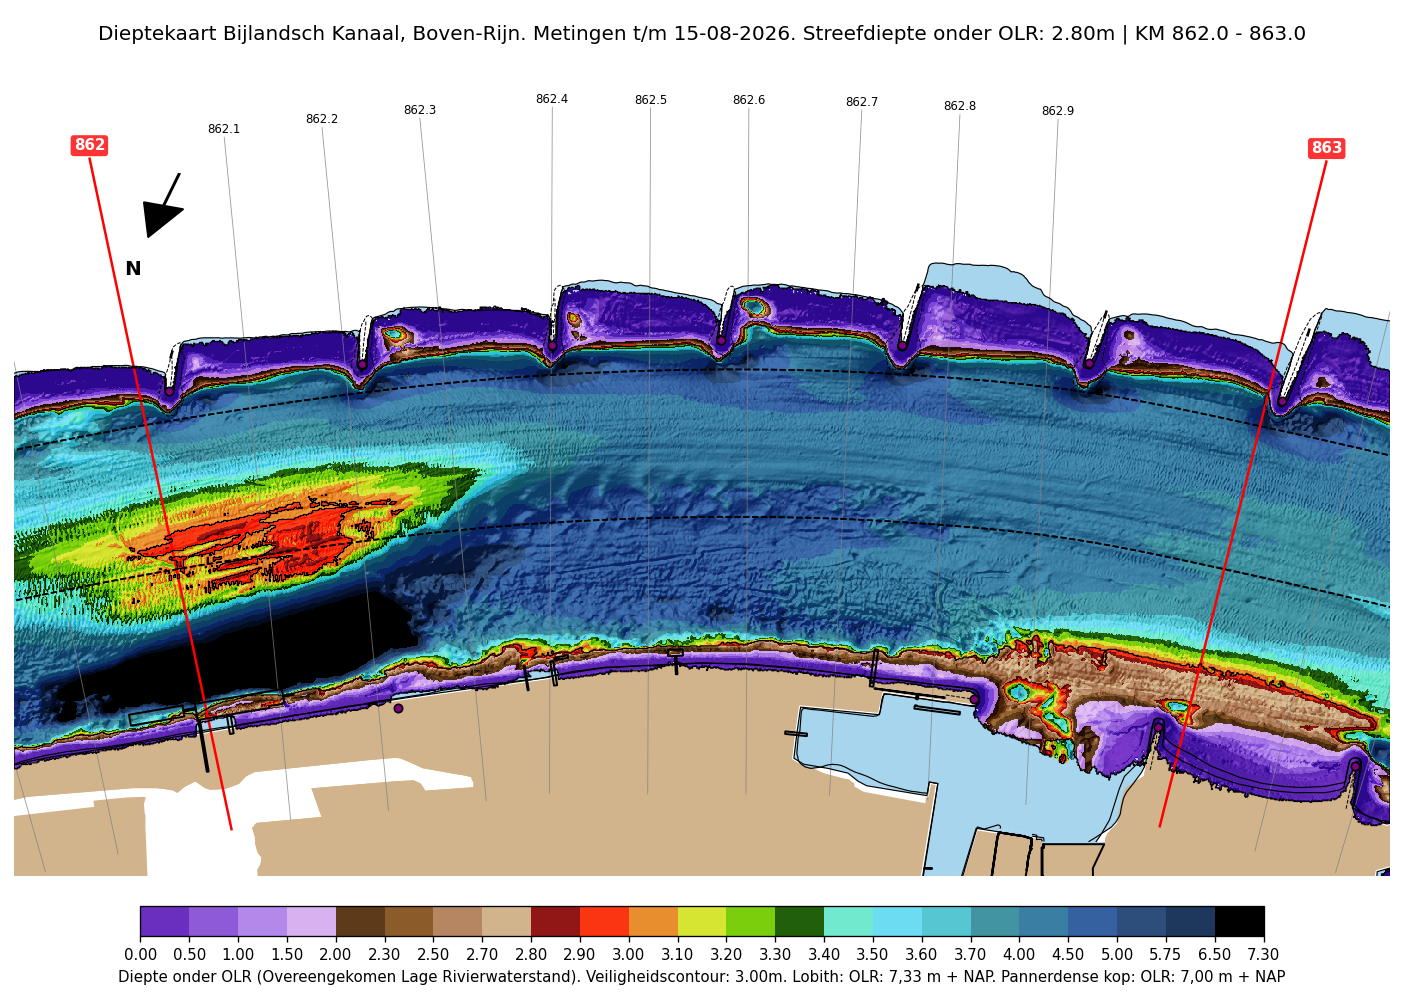
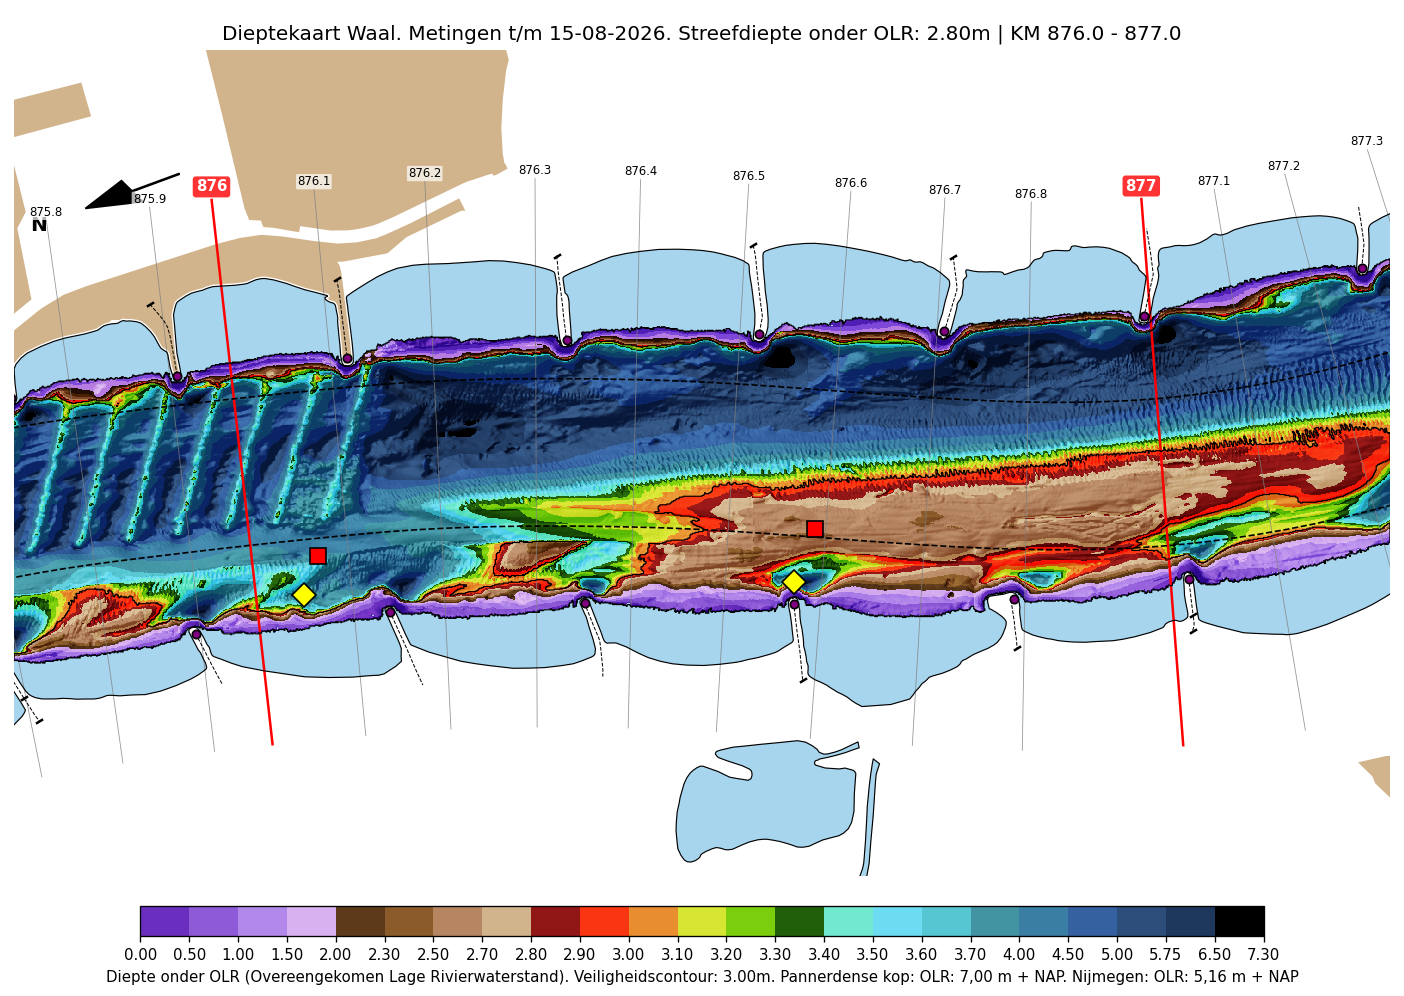
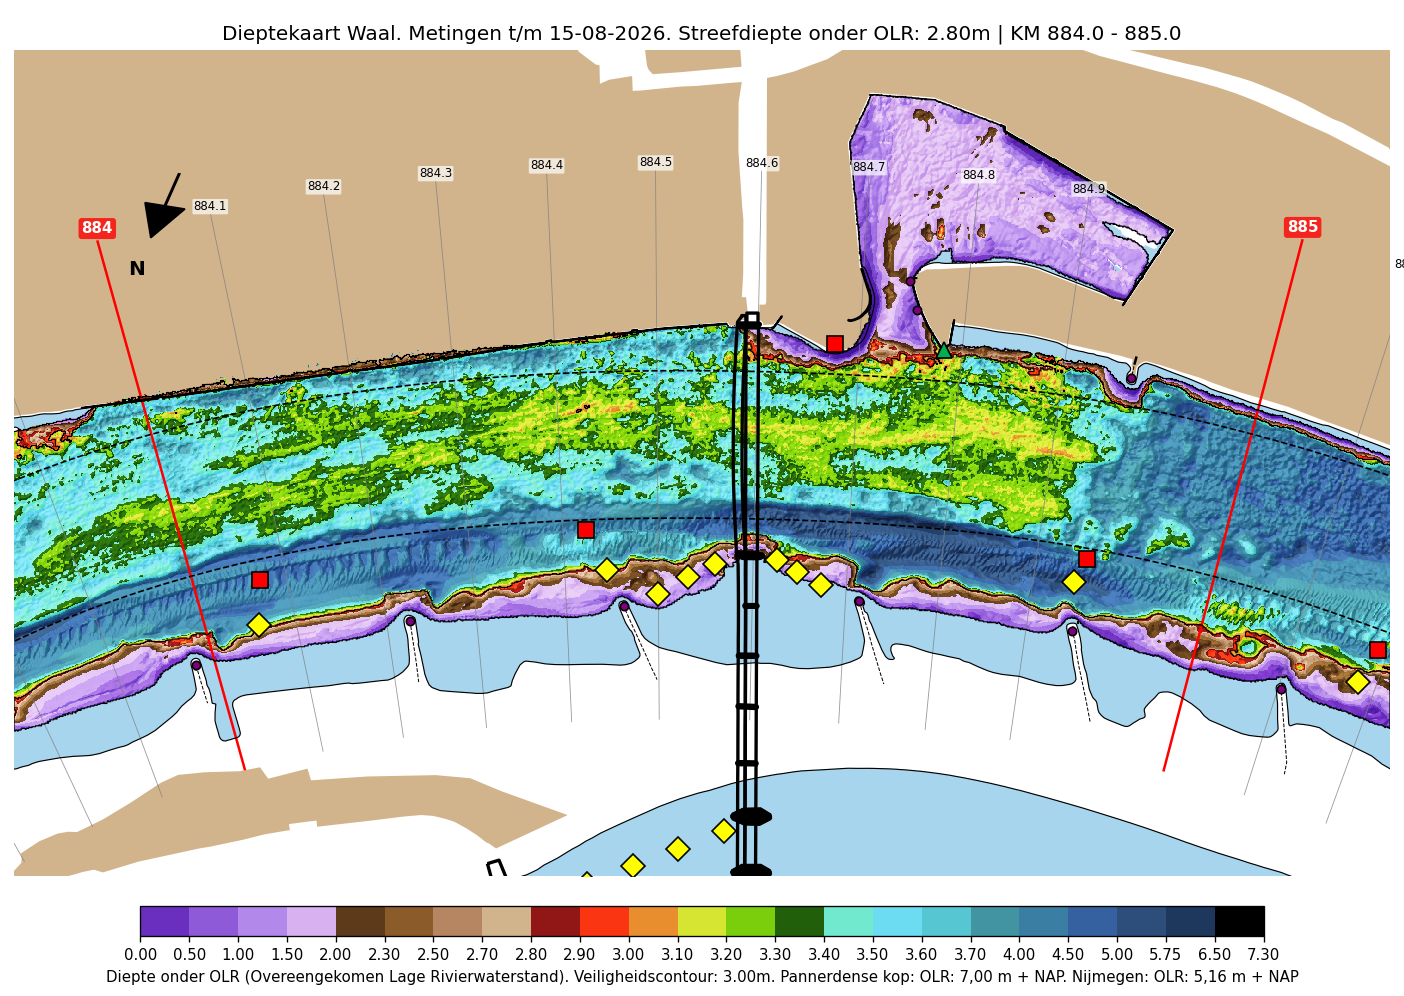
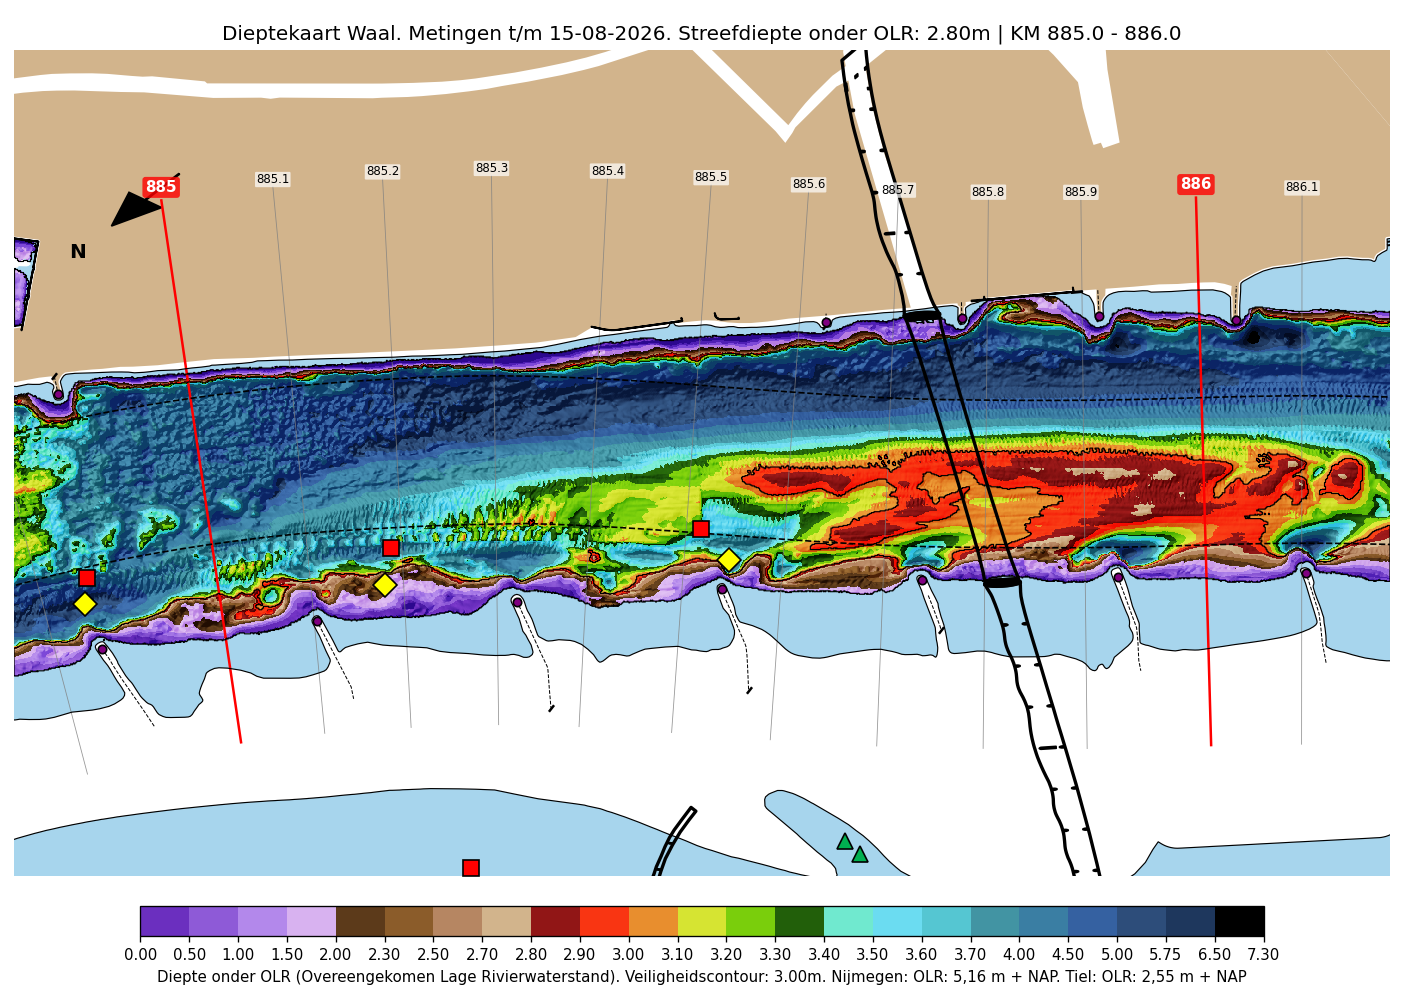
A depth chart shows, per river kilometre, how deep the water really is. It is measured against the low water reference level. Red indicates shallow water, with different colours for nearly shallow water or water that is shallower still. The red colour with the safety contour is drawn around the depth that the waterway authority guarantees, or in the case of the Rhine/Waal around the shallows you have to avoid when using the deep rules of thumb (Nijmegen -250/240 cm). The official fairway and the buoyage are marked on the chart as well, to make it easier to get your bearings and to make clear how poor the fairway from the navigation charts actually is. Inside the channel it is sometimes deep where it is deeper outside the channel.
Download depth charts (PDF, pdf v20-08-2026)For the Dutch rivers the bed level files of Rijkswaterstaat are read in per district and converted to depth below the reference level that applies on that stretch. For the German Rhine the Tiefenatlas of the WSV is the source. The WSV charts keep to different colours and have less detail than the Dutch charts and are also less recent, but the reference level (GlW) is the same as in the Netherlands (OLR). Each sheet states the date up to which the soundings have been included.
The Dutch charts are updated weekly to monthly, depending on the sounding frequency. At the end you can see how the newest sounding differs from the previous one, to get an idea of how the river is developing.
The Boven-IJssel is the shallowest part.